
The First Framework Got It Wrong
Nine dimensions, 48 indicators, hundreds of evaluated concepts. Factor analysis told us three of those dimensions were redundant, two were incoherent, and two were measuring the wrong thing entirely.
The first version of the evaluation framework had 9 dimensions and 48 indicators. Each dimension was scored by an independent AI call with no access to other dimension scores. The scoring protocol was sound: isolated evaluation prevented halo effects and produced clean per-dimension distributions. The dimension definitions were not.
We ran hundreds of venture concepts through v1 of our decomposition and evaluation framework. At that volume, the dimension-level correlation structure became visible. The data showed three structural problems.
Three Problems
Redundancy. Two dimensions correlated at r = 0.59. Both appeared to capture aspects of "investability" rather than independent venture characteristics. One was designed to measure outcome potential (upside dynamics, pricing power, competitive positioning). The other was designed to measure capital attractiveness (fundability, investor appetite). The factor analysis suggested they were measuring the same underlying construct from different angles. High scores on both inflated the composite without adding independent information.
A second pair correlated at r = 0.54. Both were asking "does the opportunity exist?" through different proxies: one from the market side (is the market large enough?), the other from the buyer side (will someone actually pay?). Both constructs matter, but scoring them as separate dimensions with separate weights allowed them to double-count overlapping signal in the composite.
Incoherence. Some dimensions bundled unrelated uncertainties into a single scored category. One dimension mixed demand-side indicators (buyer behavior, purchase intent) with channel-side indicators (distribution access, adoption friction). Another mixed competitive landscape assessment with market timing signals. These did not correspond to single investigable uncertainty categories. When the resolution value engine asks "where should the next dollar of investigation go?", it needs dimensions that map to coherent investigation pathways. A dimension that bundles two unrelated uncertainties cannot produce a clean investigation priority.
Category errors. Two dimensions measured properties other than the venture itself. One captured the information landscape: how testable is this hypothesis? How available is the data needed to evaluate it? The other captured portfolio-level interactions: how does this concept relate to other entities in the pipeline? Both had operational value. Neither addressed the gate question: should this entity advance? They were useful inputs to the studio's process, but they did not belong in the per-entity evaluation instrument.
What the Correlation Matrix Revealed
The original 9 dimensions had 4 off-diagonal pairs with correlations above 0.50. The highest (r = 0.59) was between the outcome potential dimension and the capital attractiveness dimension. The second highest (r = 0.54) was between two demand-adjacent dimensions that should have been measuring different things but were not.
Correlations above 0.50 between scored dimensions, despite isolated scoring calls that prevented halo effects, are empirical evidence that the dimension definitions themselves overlap. The decomposition was measuring the same underlying constructs from different angles rather than capturing independent categories of uncertainty.
The factor analysis also revealed that the principal components did not align with the dimension boundaries. One dimension's indicators loaded across two separate factors in PCA, suggesting it was actually two constructs forced into one category. Another dimension's indicators appeared to decompose into facets of three other dimensions: its growth indicators belonged with demand, its pricing indicators belonged with economics, and its competitive indicators belonged with defensibility. It was not a dimension. It was a residual category collecting indicators that did not fit elsewhere.
The Capital Attractiveness Problem
The capital attractiveness dimension deserves specific attention because its removal reveals a structural nuance of the problem we are trying to solve: what factors allow a credibly objective investigation into the potential of a proposed venture? Capital attractiveness is largely reflective of the potential for success itself.
Capital attractiveness was designed to capture how fundable a venture would be: investor appetite for the sector, comparable transaction evidence, the studio's positioning relative to the market. It carried meaningful weight in the v1 composite score.
The factor analysis showed it was approximately 60% downstream of the other dimensions. A venture with strong demand, proven feasibility, sound economics, and a defensible position is more fundable. That is not independent signal. It is a consequence of the other scores. Scoring it as a separate dimension and including it in the weighted sum effectively double-counted the strength of ventures that were already scoring well on fundamentals.
The remaining 40% was genuine independent signal: macro capital market conditions, sector-specific investor sentiment, and the studio's own positioning and track record. This signal is real but it is not a property of the venture. It is a property of the environment. A venture's quality does not change because the funding market shifts. The venture's fundability changes, but fundability and quality are different things.
The MAUT requirement for non-redundancy made the decision clear. Capital attractiveness could not remain as a scored dimension because its indicators were largely measuring the same constructs as indicators in other dimensions. Including it inflated the composite score without adding independent information. The downstream portion was redundant. The independent portion was extracted as a non-scored overlay: a separate assessment of market conditions and studio positioning that informs portfolio-level strategy without contaminating the per-entity evaluation.
From 9 to 6
Every indicator from the v1 instrument was traced to a destination. Nothing was discarded without a stated reason.
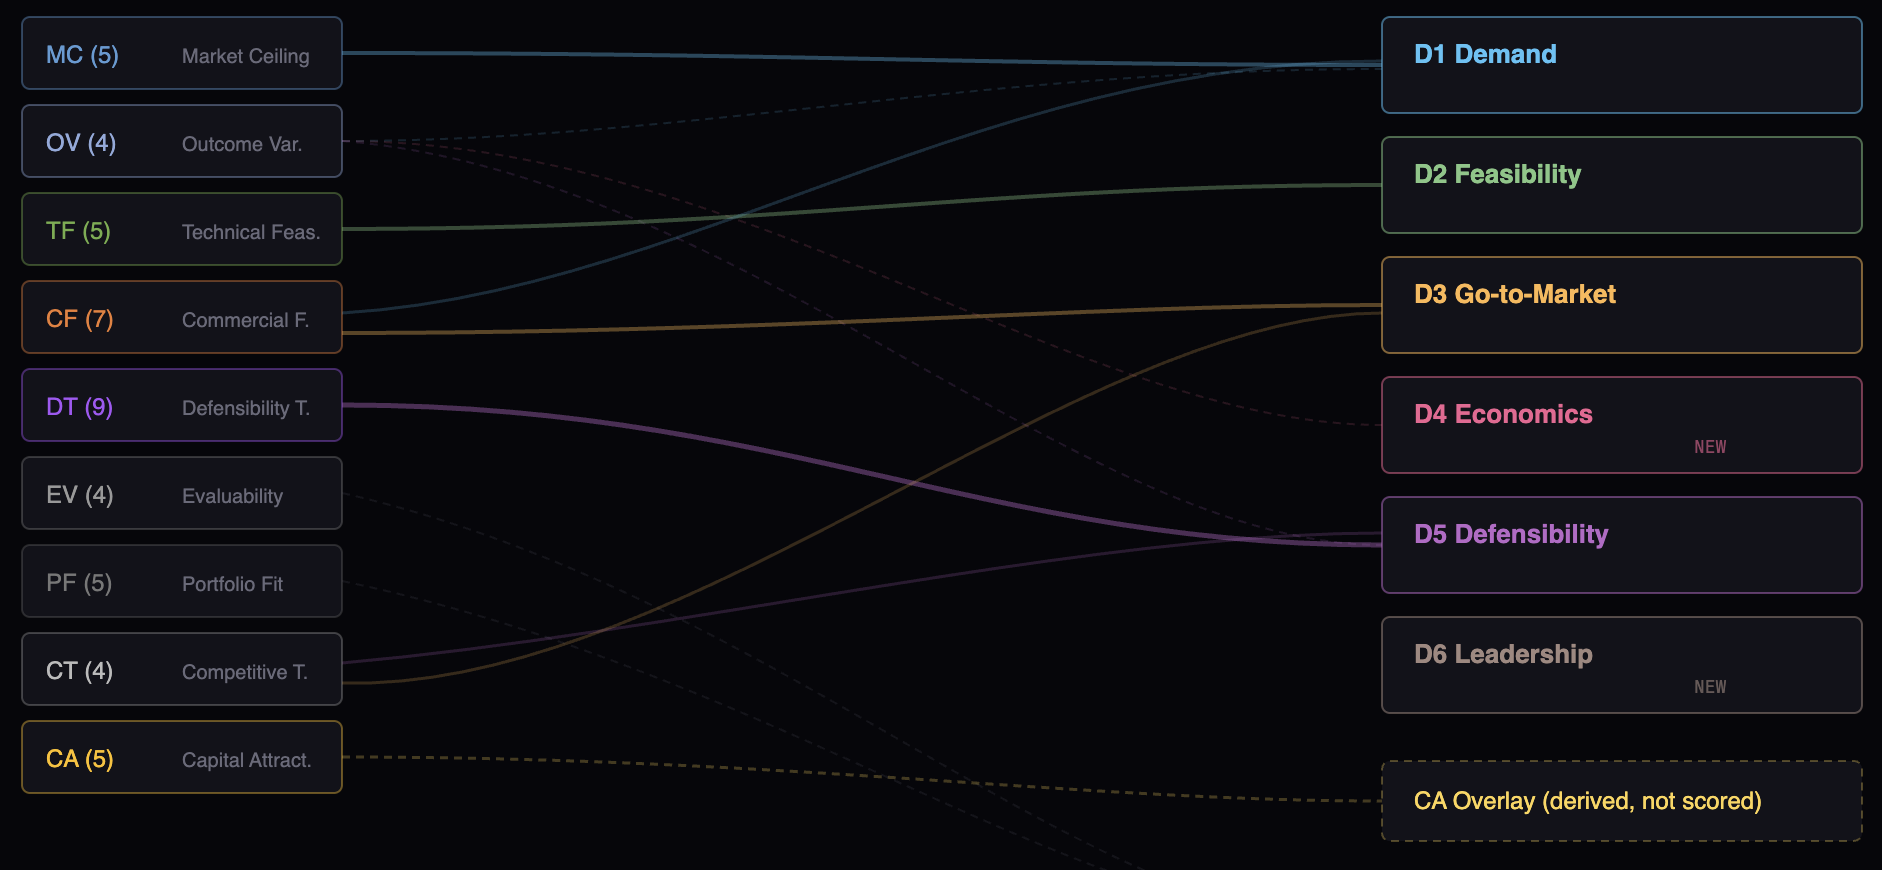
The outcome potential dimension was dissolved. Its indicators were redistributed across Demand, Economics, and Defensibility based on which construct each indicator most naturally addressed. The dimension had never been a coherent category. It was a collection of "upside" signals that belonged in different places.
The two demand-adjacent dimensions were merged and restructured into two clean categories: Demand (does the problem exist, will someone pay, how large is the market) and Go-to-Market (can we reach buyers, what are the distribution dynamics, what friction exists in the sales cycle). The buyer-facing indicators went to Demand. The channel-facing indicators went to Go-to-Market. The pricing indicators went to Economics.
The dimension that split across two PCA factors was separated into its constituent constructs: competitive landscape indicators went to Defensibility, market readiness indicators went to Go-to-Market.
The two category-error dimensions were removed from the scoring instrument entirely. One (evaluability) became an input to the resolution value calculation: how testable is this uncertainty, and at what cost? The other (portfolio fit) became a portfolio-level capital allocation mechanism rather than a per-entity score. Both retained their operational function. Neither remained in the gate-decision framework.
Capital attractiveness became the CA overlay, as described above.
The result: 6 dimensions, 33 indicators. Indicators scored on a Likert scale with rubric anchors, replacing the v1 binary scoring. Epistemic states (0-4) added a layer the v1 instrument lacked entirely: a structured measure of how well each score is known, not just what the score is.
What Stayed the Same
The core scoring protocol was unchanged: independent AI calls per dimension, with no access to other dimension scores. That isolation was the right decision from the beginning, and the statistical problems were in the dimension definitions, not in the separation between scoring calls. What did change was the boundary conditions within each call. The v2 prompts include explicit definitions of what each indicator should and should not evaluate, preventing an indicator from implicitly capturing signal that belongs to a different indicator. The isolation between calls was already clean. The scope within each call was tightened.
The theoretical grounding was also unchanged. The framework was always intended as a MAUT decomposition. The v1 implementation failed to satisfy MAUT's requirements empirically. The v2 implementation was designed to satisfy them. Empirical validation will follow as entities are evaluated under the new instrument.
The aggregation changed fundamentally. The v1 instrument used a weighted additive sum. The v2 framework uses rNPV aggregation: indicators map to probability of advancing, terminal value, and cost components in a staged option chain valuation. The additive sum was not just statistically problematic (it was). It was structurally wrong. Probability and terminal value interact multiplicatively in the option value equation. Averaging across them conceals structural zeros where a strong terminal value indicator masks a near-zero probability indicator. In decision analysis terms, this should allow for the natural emergence and identification of non-compensatory factors, but only time and data will tell that story.
What This Means
The framework produced the data. Factor analysis on that data revealed the structural problems. When the correlations showed the dimensions were wrong, the dimensions changed.
This is what separates a quantitative system from a qualitative one. A qualitative framework can persist indefinitely with flawed categories because it produces no structured data to analyze. A quantitative framework produces the data that makes its own flaws visible. The hundreds of entities that exposed the v1 problems also provided the evidence needed to design the v2.
The crosswalk validation against 8 published frameworks gave us confidence that the reduced-dimension model maintained meaningful coverage of the uncertainty categories that practitioners and researchers have independently identified over four decades. The factor analysis gave us confidence that the new dimensions were measuring more independent constructs than the old ones. Neither is proof. Both are evidence that the redesign moved in the right direction.
The framework will continue to be tested against its own output. If the next 500 entities reveal a correlation structure that violates the design assumptions, the architecture will change again. The entire v1 build took us around 6 working days to complete and we estimate that 80% of this work lives on to serve v2. Token costs were $21.47 to evaluate the first 512 entities in v1. Money well spent. This is the system working as designed.